TL;DR

Get smart everyday buys delivered free with Prime
- Fast, free delivery on millions of items
- Prime Video, Amazon Music and more included
- Member-only deals all year
Since the Iran war began on February 28, higher oil prices and disruption around the Strait of Hormuz have coincided with increases in U.S. inflation, fuel, heating and travel costs. The supplied report says grocery prices have risen more modestly so far, but higher farm input and transport costs could feed through later; the conflict’s duration and future prices remain uncertain.
U.S. prices have risen since the Iran war began on February 28, with the latest inflation figure cited by Kiplinger reaching 3.7% year over year in September, up from 2.4% in February. The report links much of the pressure on household budgets to higher oil prices amid the closure of the Strait of Hormuz, with fuel, heating and travel costs already affected and grocery impacts potentially still building.
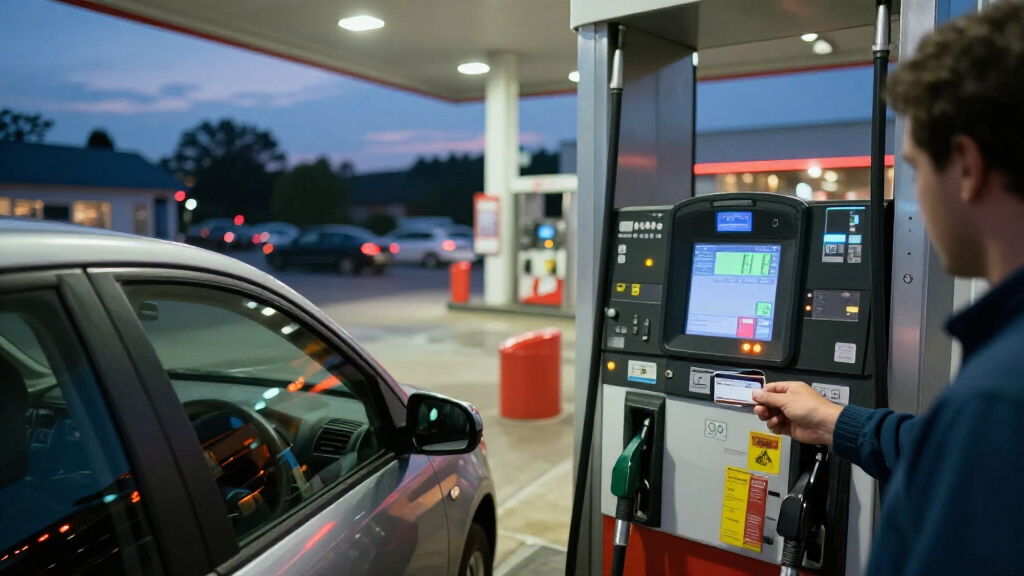
Fuel has registered some of the sharpest increases in the report. AAA data cited by Kiplinger put the U.S. average gasoline price at $4.29 a gallon on October 19, compared with $2.93 on February 23, a rise of more than 46%. Diesel rose 66% over the same period. The report notes that crude oil makes up more than half of the cost of gasoline at the pump, while diesel is widely used to transport farm products and other goods.
Oil prices moved sharply during the period. Brent crude was $72.87 a barrel on February 27, the day before the conflict began, and exceeded $112 by March 20. After briefly returning to pre-war levels in July, it climbed above $100 in August and was trading above $109 in October, according to the source report. These movements are relevant to costs, but they do not by themselves establish how much of any particular price change was caused by the conflict.
Household energy and travel costs have also risen in the figures cited. Federal Reserve data showed home heating oil prices up 128% from January to September, while U.S. residential natural gas prices rose 77% from February to July, the latest month then available from the Energy Information Administration. The International Air Transport Association put jet fuel at $192.44 a barrel in October, nearly twice its February level; it estimates fuel accounts for about 30% of airline operating costs.
Fuel Costs Reach Beyond the Pump
Higher fuel prices can affect household budgets directly through gasoline, heating and airfares, and indirectly through the cost of moving goods. Kiplinger notes that nearly 80% of U.S. farm products travel by diesel-powered truck at some point, while most consumer goods also rely on truck transport. That makes diesel costs a potential pressure on prices beyond transport and energy.
The grocery-price data in the report show a smaller increase so far: the Bureau of Labor Statistics’ food-at-home index rose 1.1% since the war began. But the report says fertilizer, pesticides and animal feed are exposed to oil-linked materials or supply routes affected by the Strait of Hormuz. It cites fertilizer as roughly 30% of the cost of producing staple crops such as corn and wheat, and feed as at least 60% of livestock production costs. These figures describe possible cost channels, not a guarantee of a particular future increase in store prices.
For households, the timing matters. Some energy costs can respond quickly to changes in oil markets, while changes in agricultural input costs may take longer to appear in food prices. That means the price pressures visible now may not capture the full effect of the disruption, but the eventual size and timing depend on market conditions and how the conflict develops.
As an affiliate, we earn on qualifying purchases.
The Price Measures and Their Dates
The figures come from different sources and cover different periods, so they are not a single synchronized measure of the conflict’s effect. The report compares September year-over-year inflation with February’s rate, gasoline prices on February 23 and October 19, heating oil from January to September, and residential natural gas from February to July. Those date ranges should be kept distinct when comparing changes.
The report also places recent grocery increases against a longer run of inflation: food-at-home prices were up 5.2% since January 2024 and nearly 32% since 2020. Those broader comparisons show that grocery costs had already risen substantially before the war began. The war-related contribution cannot be read directly from those cumulative figures.
Kiplinger attributes the oil-market pressure primarily to the Strait of Hormuz closure. The supplied report does not provide a detailed breakdown separating the conflict’s effect from other influences on each price series. Nor does it give a full set of current figures for every category it discusses; the natural-gas figure, for example, ends in July.
“Gas prices are up more than 46% since the war began.”
— Kiplinger report
As an affiliate, we earn on qualifying purchases.
How Much Costs May Still Rise
The figures show price changes during the period, but the supplied report does not quantify how much of each increase was caused by the Iran war rather than other market forces. The conflict’s duration, future oil prices and the timing of any easing in the Strait of Hormuz disruption are also not established in the source material.
Some data are incomplete or lagged: residential natural-gas prices are reported only through July, and the food-at-home index’s modest increase so far may not reflect later changes in farm input and transport costs. Kiplinger cites an S&P Global expectation of further food-price increases, but provides no product-by-product amounts or timing. The scale and speed of any pass-through to grocery shelves remain unclear.
As an affiliate, we earn on qualifying purchases.
Watch Energy and Food Data
Readers can track upcoming inflation releases, fuel-price averages and energy data to see whether costs continue rising or begin to ease. Later grocery-price readings will help show whether higher fertilizer, feed and transport expenses have reached consumers. Those reports should be compared using their stated measurement periods, since the source figures do not all cover the same months.
The outlook also depends on developments in the conflict and oil supply. Kiplinger says gasoline prices could fall relatively quickly if oil prices decline, but it notes that the future path is difficult to predict. Its suggestions to compare utility plans or consider home-heating options are consumer guidance, not a forecast of what prices will do; no particular rate or household measure is guaranteed to save money.
As an affiliate, we earn on qualifying purchases.
Key Questions
How much has inflation increased since the Iran war began?
Kiplinger says the latest CPI figure in its report was 3.7% year over year in September, compared with 2.4% in February. These are inflation rates for their respective reporting periods, not a measure of the cumulative price increase since February.
How much did gasoline prices rise?
AAA’s national average was $2.93 a gallon on February 23 and $4.29 on October 19, a rise of more than 46% over that comparison period, according to the report.
Have grocery prices risen as much as fuel prices?
No. The report says the BLS food-at-home index increased 1.1% since the war began, less than the reported rise in gasoline and diesel. It warns that farm input and shipping costs could affect grocery prices later, but the amount and timing are uncertain.
Why could diesel prices affect food costs?
Diesel-powered trucks transport farm products and many other goods. Higher diesel costs may add to the expense of moving food from farms to stores, though the report does not calculate how much of any grocery-price change is attributable to diesel.
When might prices come down?
The source does not give a date. Kiplinger says gasoline can respond relatively quickly to changing oil prices, while other costs may adjust more slowly. Future prices depend in part on oil markets and how the conflict develops.
Source: rss
Halloween Picks
halloween
As an affiliate, we earn on qualifying purchases.